Sales
| Figure | Meaning |
|---|---|
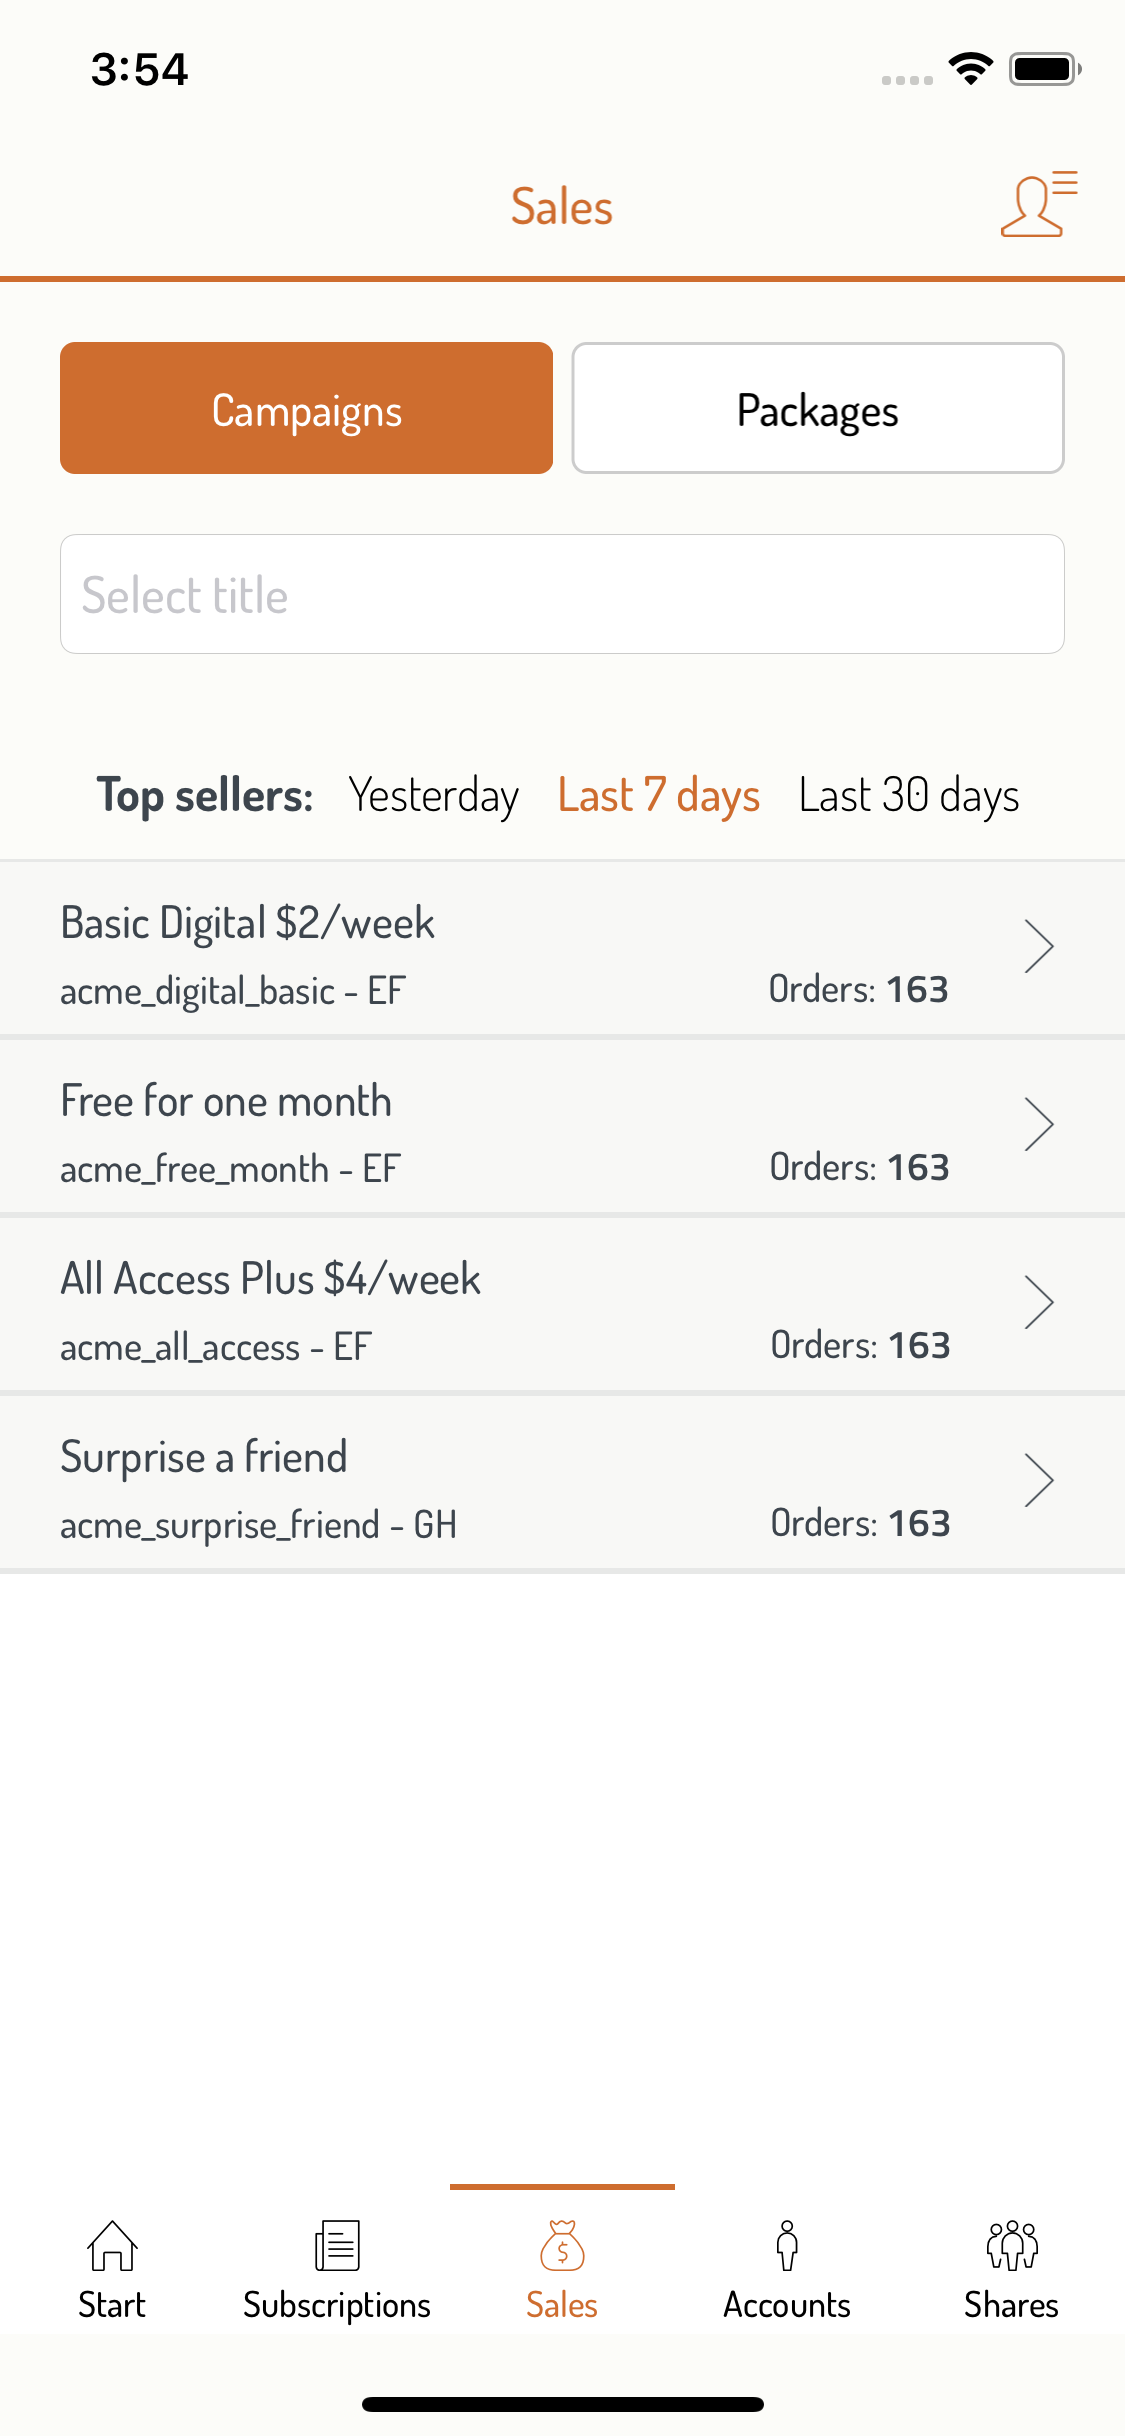 |
Overview This view shows the top selling campaigns and packages for the selected period. Title filter Lets you filter the campaigns and packages shown by selecting a title. Top sellers Choose one of the periods Yesterday, Last 7 days or Last 30 days to filter the list of top sellers. The default period is Last 7 days. The list is sorted by the number of orders during the period. |
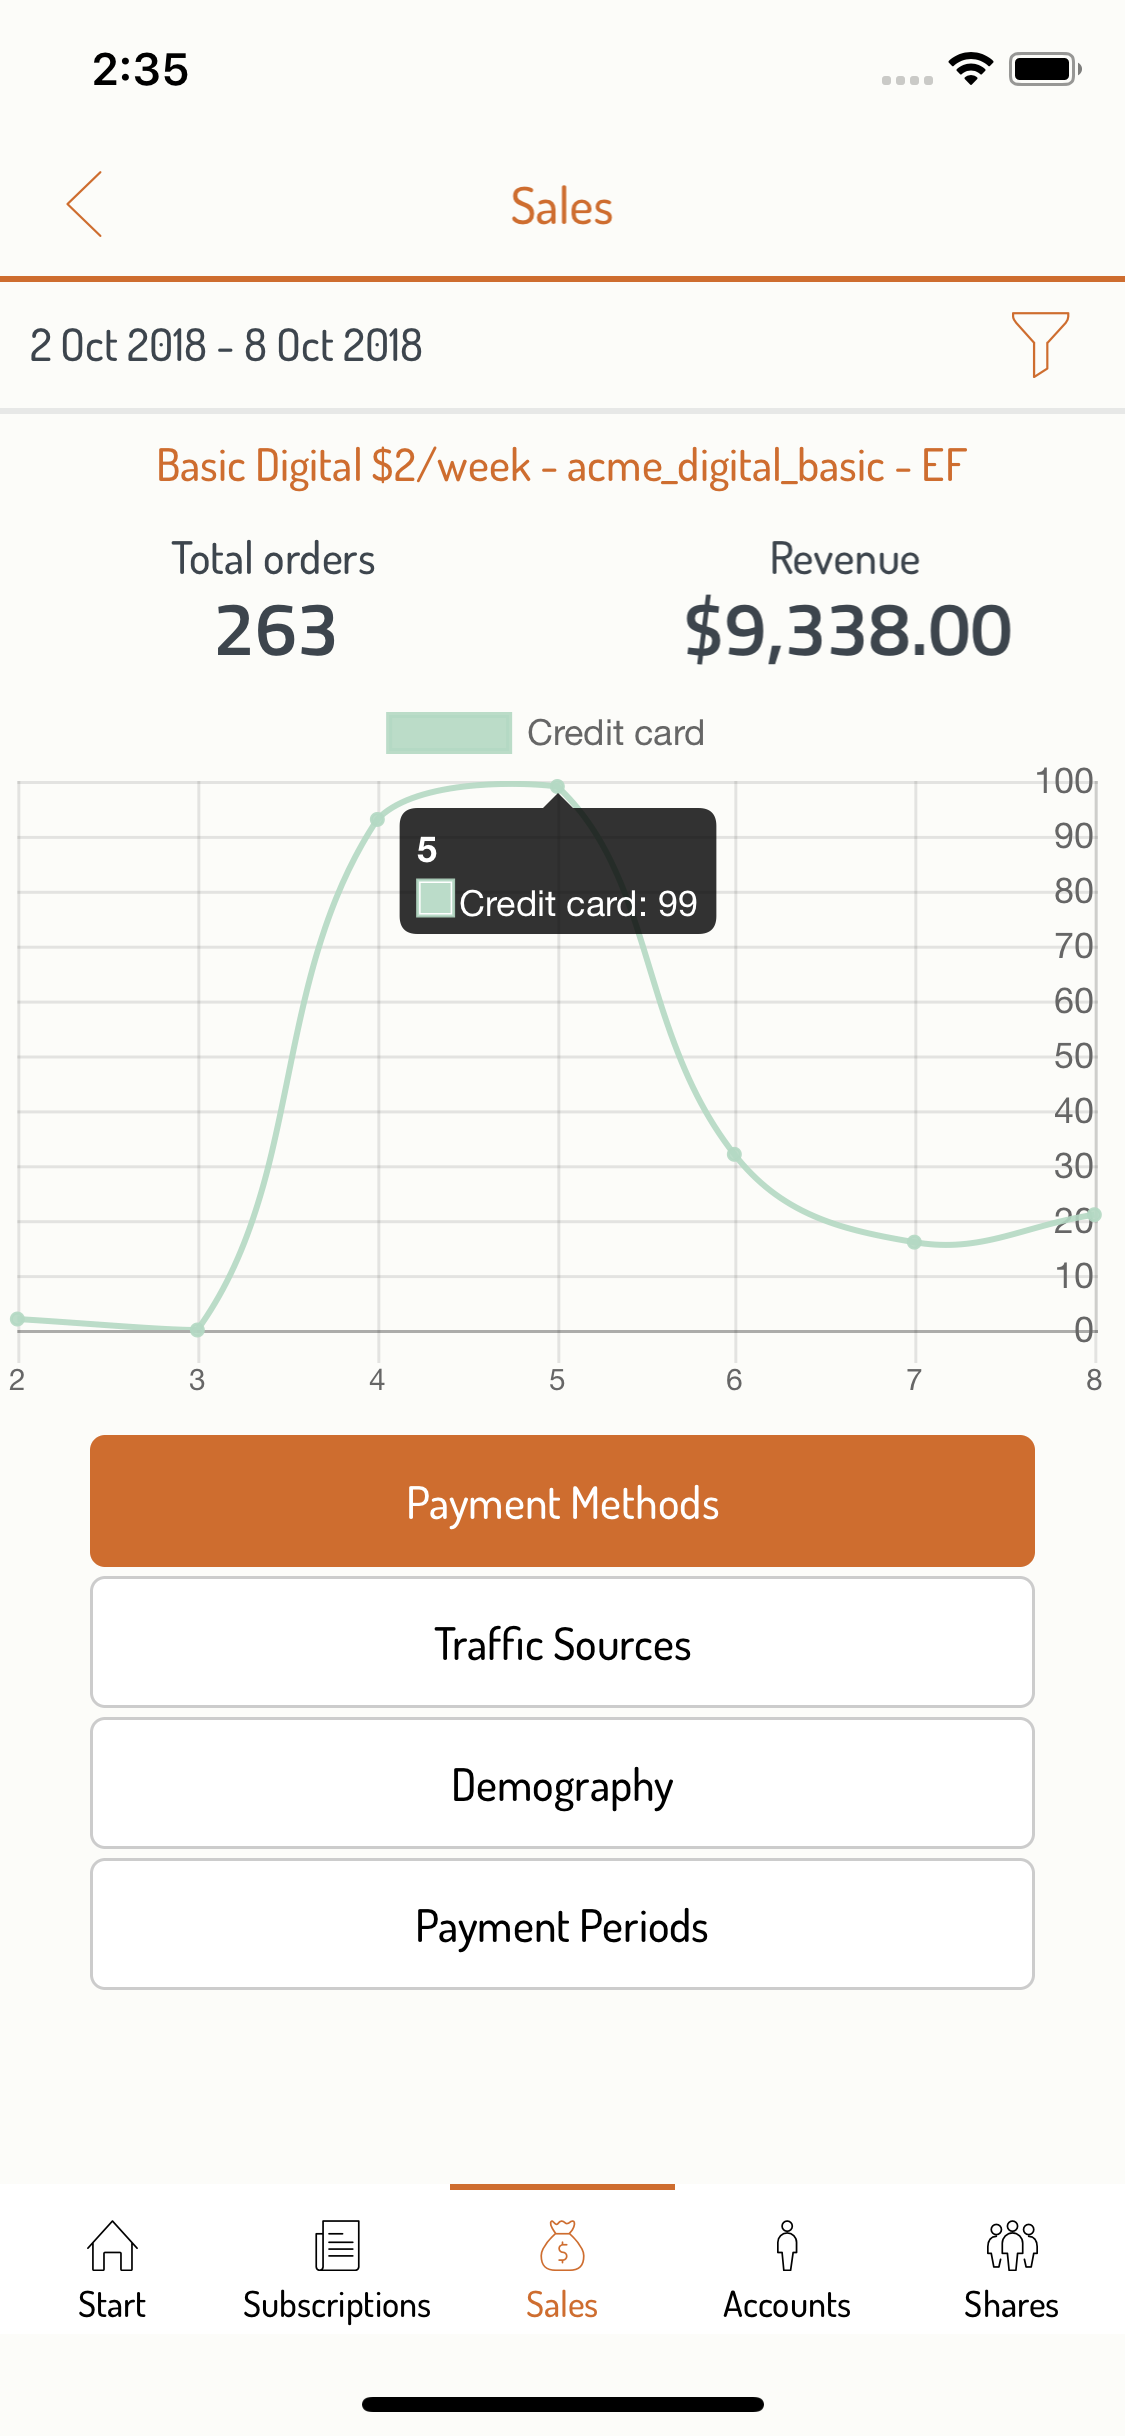 |
Selected campaign or package / Payment Methods Header
Payment Methods line chart Shows used payment methods per day. Possible payment methods are
Chart filter
|
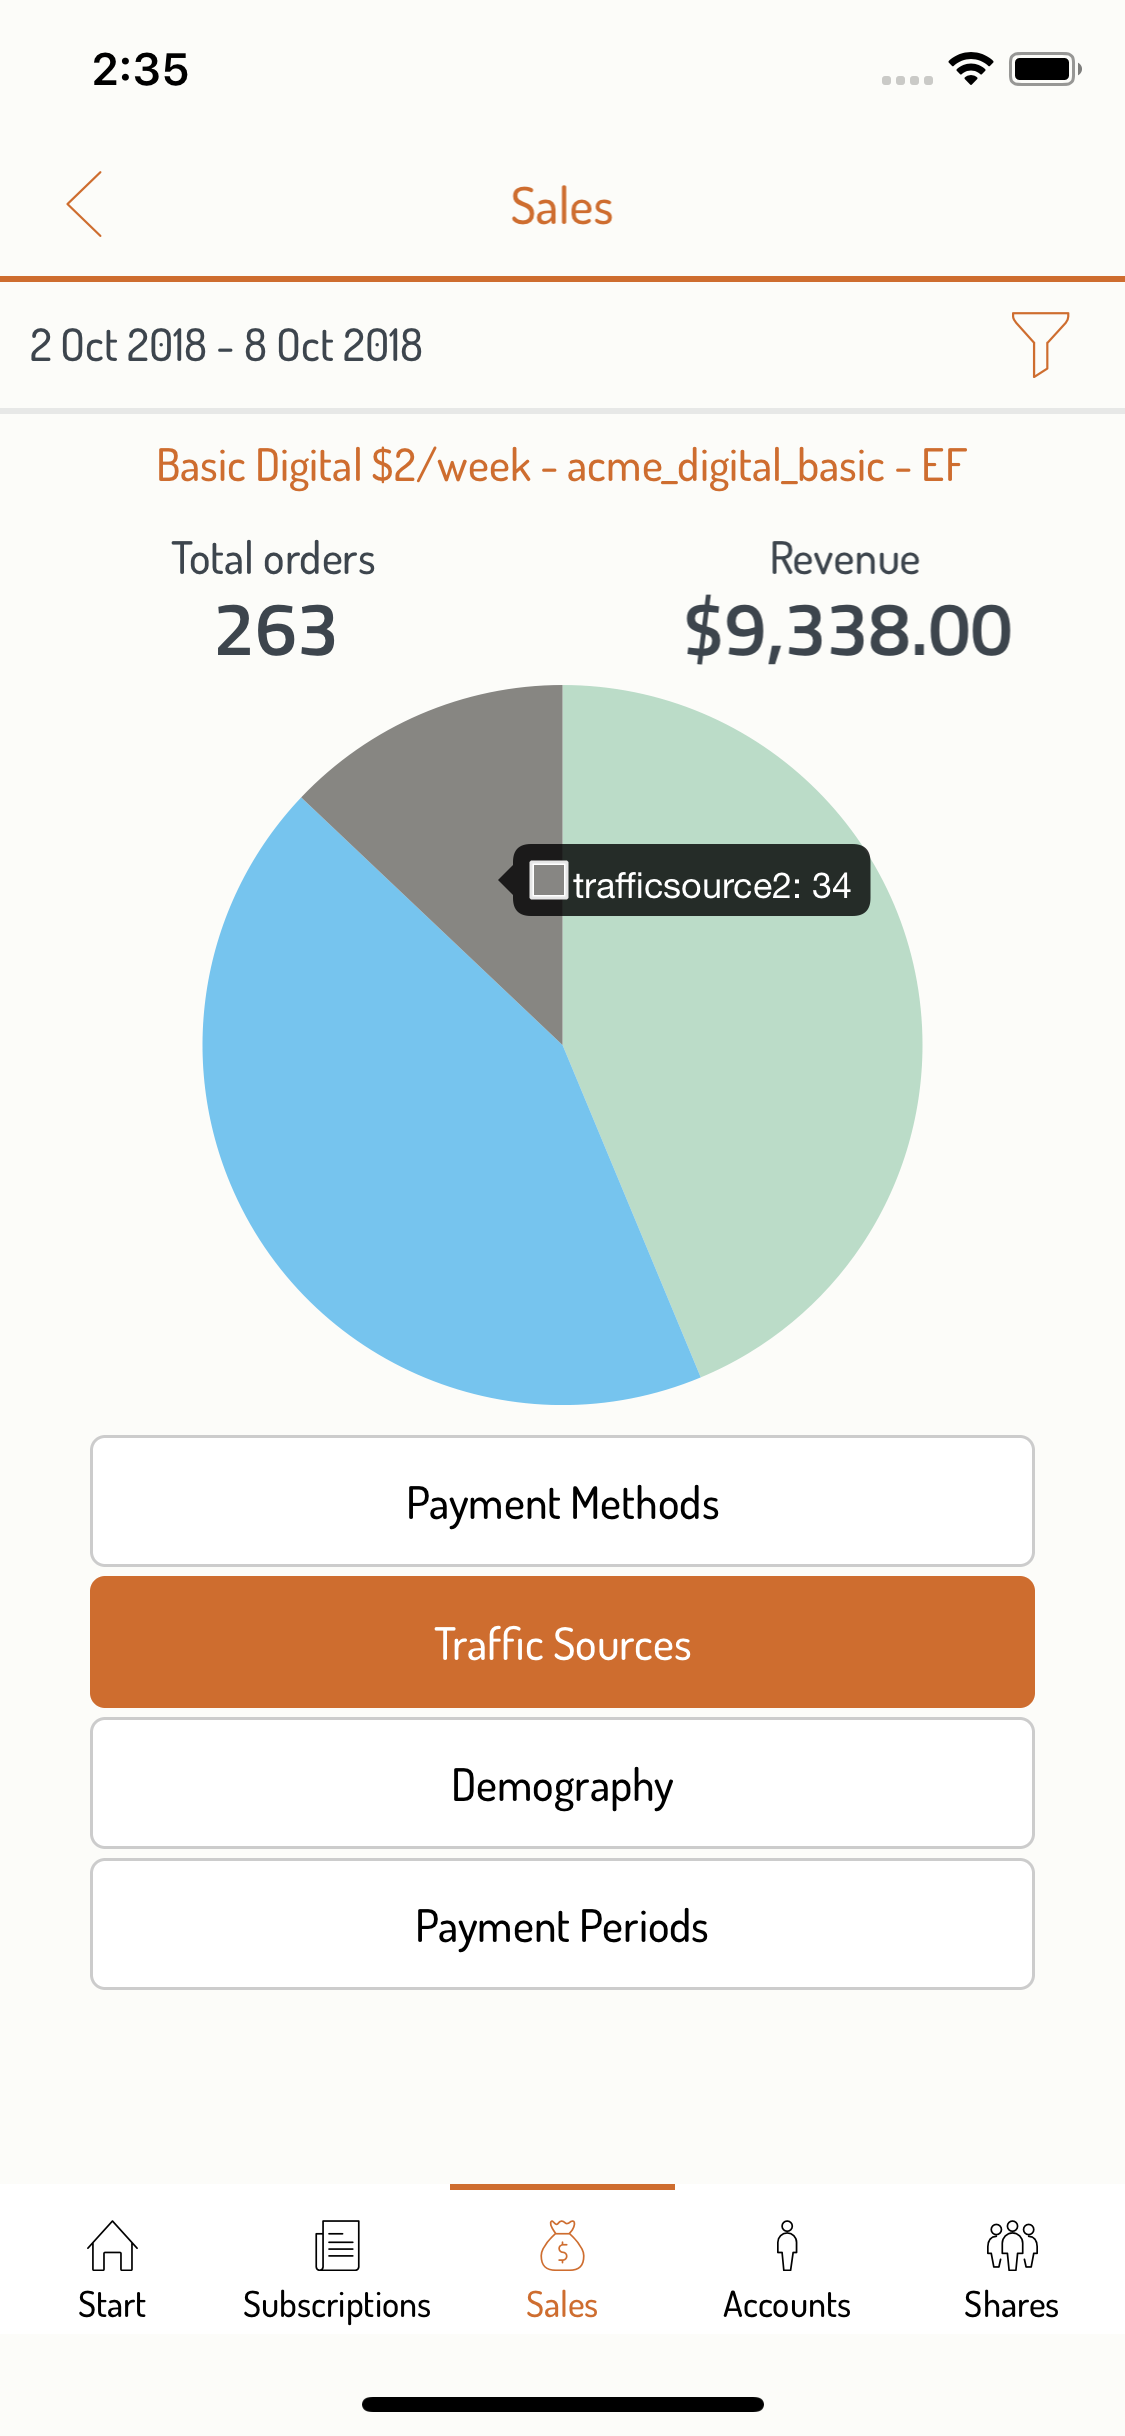 |
Selected campaign or package / Traffic Sources Traffic Sources pie chart Shows which traffic sources the orders originated from. Each slice can be tapped to show name of the traffic source and number of orders. |
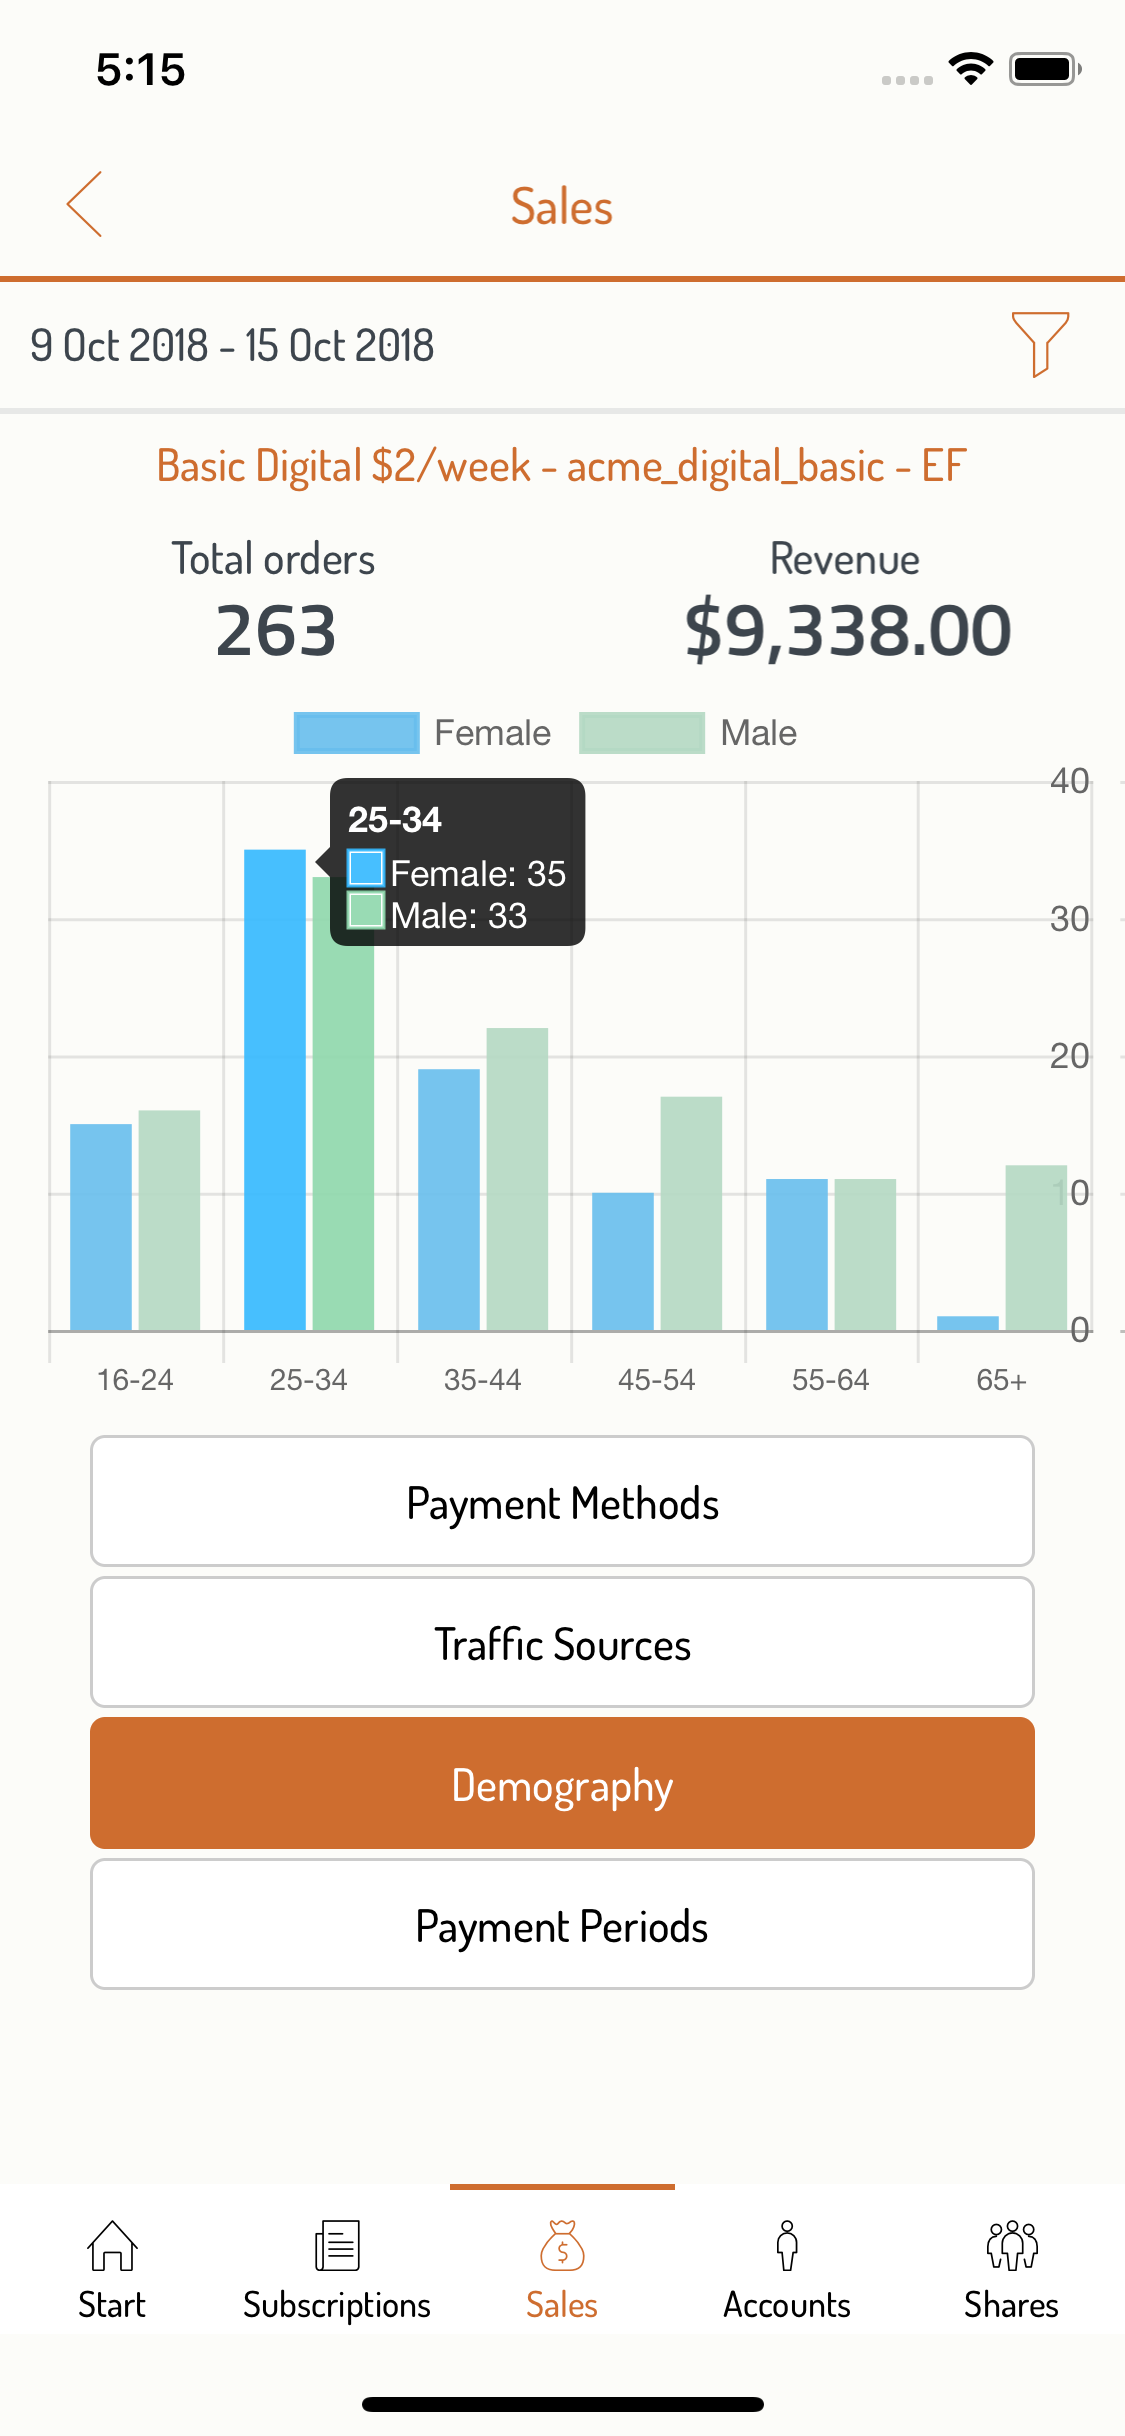 |
Selected campaign or package / Demography Demography bar chart Shows the demography divided into six age groups. Each age group bar can be tapped to show the number of female and male in the age group. |
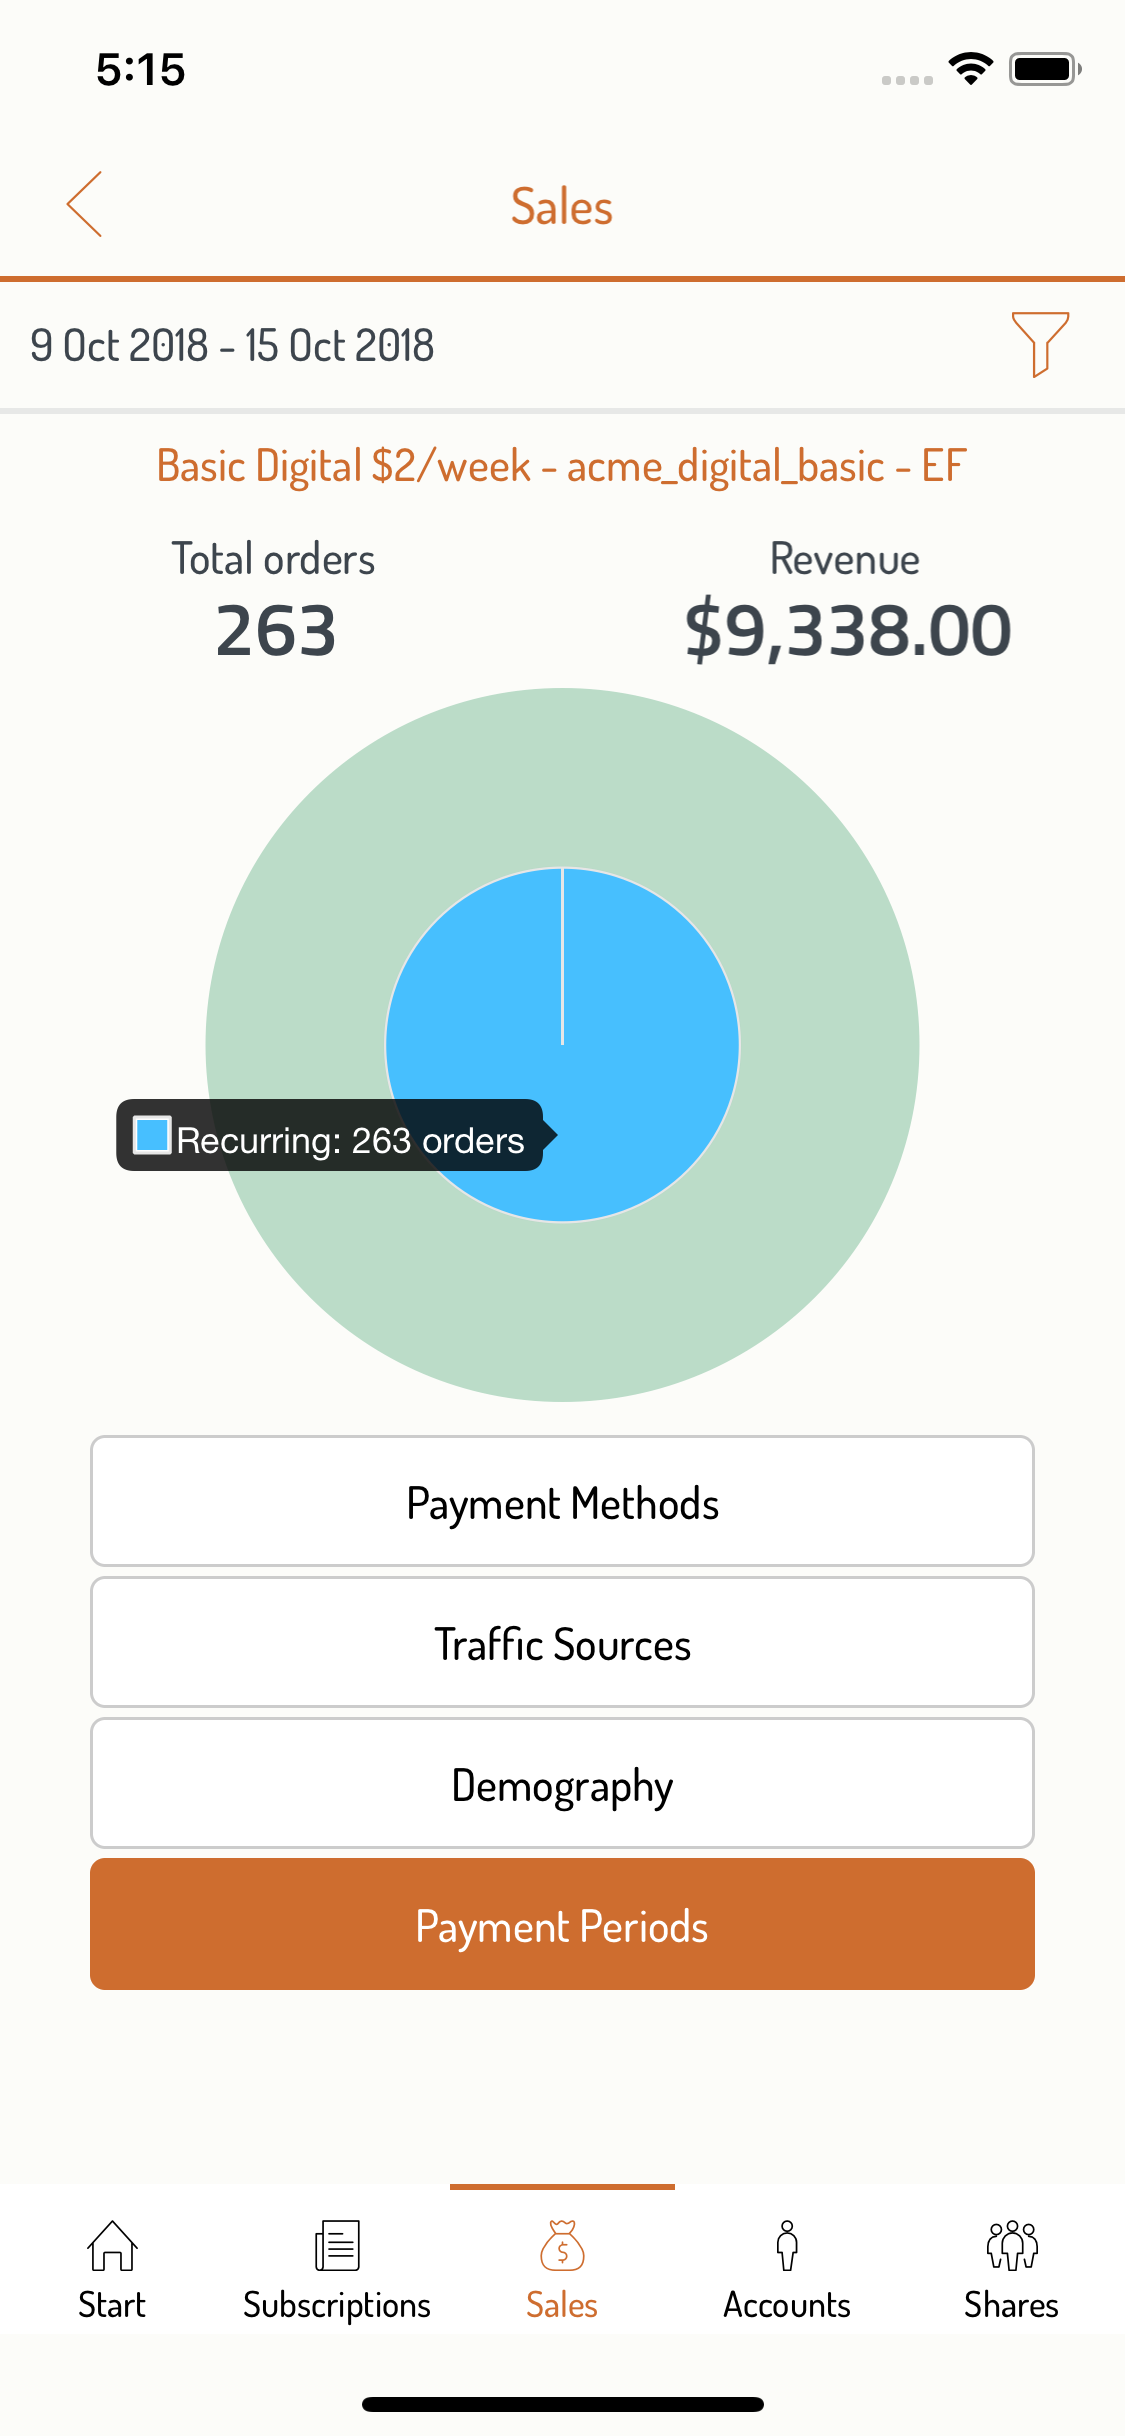 |
Selected campaign or package / Payment periods Payment periods multi level pie chart The outer circle shows period lengths purchase during the selected period. Each slice can be tapped to show the period length and number of orders. The inner circle shows the type of purchase (limited or recurring). Each slice can be tapped to show the type of purchase and number of orders. |