Toplists and article
Toplist
Every KPI on the overview page can be tapped upon to present a toplist for the KPI.
| Figure | Meaning |
|---|---|
 |
Toplist Each toplist lists articles ranked by the current KPI chosen along with the KPI value for a specific article. Tapping on an article headline will bring you to the Article view. Scale Two scales are used in the app to rank the KPIs in the toplist. The scales have 4 value limits which are presented with 4 different colors.
|
Article
| Figure | Meaning |
|---|---|
 |
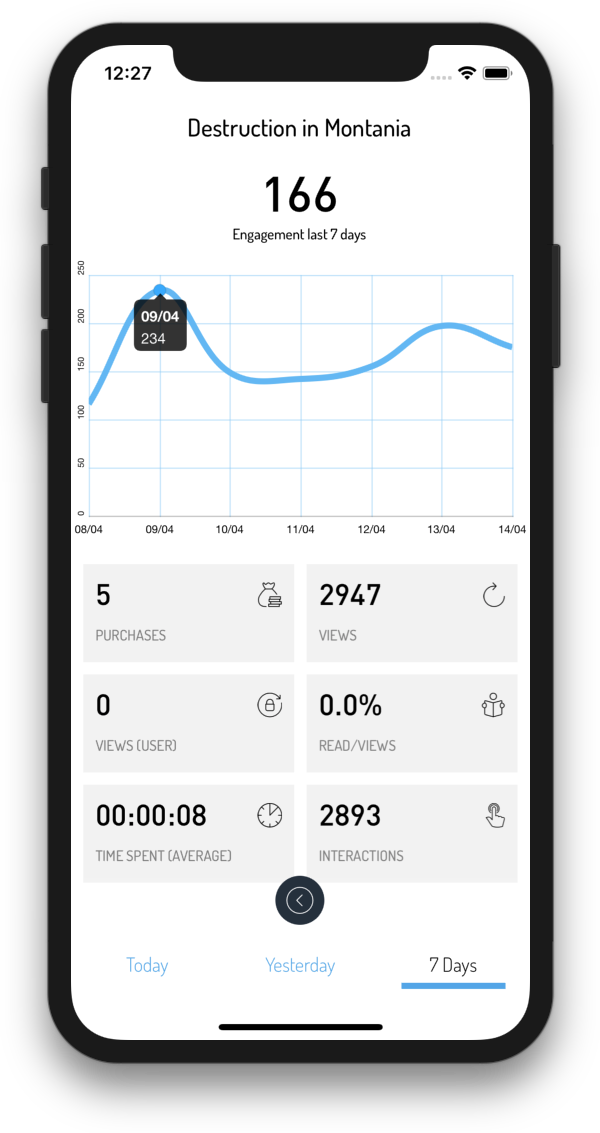
Article The article view presents the same information* as the Overview page but for a specific article. * "Time spent", average time spent on the article per view |